The Minimum Clinically Important Difference in PROMIS measures for Patients Undergoing Lumbar Decompression
The Minimum Clinically Important Difference in PROMIS Measures for Patients Undergoing Lumbar Decompression
Friday, April 21, 2023


James W. Nie, BS (he/him/his)
Medical Student
University of Illinois College of Medicine
Chicago, Illinois, United States
ePoster Presenter(s)
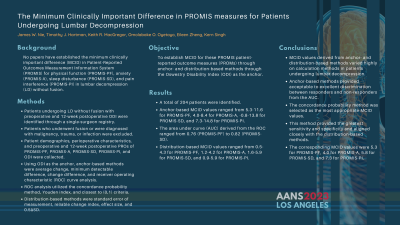
Introduction: There is a paucity of data establishing the minimum clinically important difference (MCID) in Patient-Reported Outcomes Measurement Information System (PROMIS) for physical function (PROMIS-PF), anxiety (PROMIS-A), sleep disturbance (PROMIS-SD), and pain interference (PROMIS-PI) in patients undergoing lumbar decompression (LD) without fusion. This study utilizes anchor- and distribution-based methods with Oswestry Disability Index (ODI) as the anchor.
Methods: Patients undergoing LD without fusion with preoperative and 12-week postoperative ODI were identified through a single-surgeon registry. Patients who underwent fusion or were diagnosed with malignancy, trauma, or infection were excluded. Patient demographics, perioperative characteristics, and preoperative and 12-week postoperative PROs of PROMIS-PF, PROMIS-A, PROMIS-SD, PROMIS-PI, and ODI were collected. Using ODI as the anchor, anchor-based methods were average change, minimum detectable difference, change difference, and receiver operating characteristic (ROC) curve analysis. ROC analysis utilized the concordance probability method, Youden index, and closest to (0,1) criteria. Distribution-based methods were standard error of measurement, reliable change index, effect size, and 0.5ΔSD.
Results: A total of 204 patients were identified. Anchor-based MCID values ranged from 5.3-11.6 for PROMIS-PF, 4.0-8.4 for PROMIS-A, -0.8-13.8 for PROMIS-SD, and 7.3-14.8 for PROMIS-PI. The area under curve (AUC) derived from the ROC ranged from 0.76 (PROMIS-PF) to 0.82 (PROMIS-SD). Distribution-based MCID values ranged from 0.5-4.3 for PROMIS-PF, 1.2-4.2 for PROMIS-A, 1.6-5.9 for PROMIS-SD, and 0.9-5.9 for PROMIS-PI.
Conclusion : MCID values derived from anchor- and distribution-based methods varied highly on calculation methods in patients undergoing lumbar decompression. Anchor-based methods provided acceptable to excellent discrimination between responders and non-responders from the AUC. The concordance probability method was selected as the most appropriate MCID values. This method provided the greatest sensitivity and specificity and aligned closely with the distribution-based methods. The corresponding MCID values were 5.3 for PROMIS-PF, 4.0 for PROMIS-A, 5.8 for PROMIS-SD, and 7.3 for PROMIS-PI.
